20

I would like to know how much RAM I am using in my project, as far as I can tell, there's no way to actually work that out (other than going through and calculating it myself). I have got to a stage in a rather large project where I have determined that I am running out of RAM.

I have determined this because I can add a section and then all hell breaks loose somewhere else in my code for no apparent reason. If I #ifndef something else out, it works again. There is nothing programatically wrong with the new code.

I suspected for a while that I was getting to the end of available RAM. I don't think I'm using too much stack (although it's possible), what is the best way to determine how much RAM I am actually using?

Going through and trying to work it out, I have problems when I get to enums and structs; how much memory do they cost?

first edit: ALSO, I have edited my sketch so much since starting, these are not the actual results I initially got, but they are what I am getting now.

  text     data     bss     dec     hex filename
 17554      844     449   18847    499f HA15_20140317w.cpp.elf
 16316      694     409   17419    440b HA15_20140317w.cpp.elf
 17346      790     426   18562    4882 HA15_20140317w.cpp.elf

The first line (with text 17554) was not working, after much editing, the second line (with text 16316) is working as it should.

edit: the third line has everything working, serial reading, my new functions, etc. I essentially removed some global variables and duplicate code. I mention this because (as suspected) it's not about this code per sae, it has to be about the RAM usage. Which brings me back to the original question, "how to best measure it" I'm still checking out some answers, thanks.

How do I actually interpret the above information?

So far my understanding is:

`TEXT` is program instruction memory
`DATA` is variables (unitialised?) in program memory
`BSS`  is variables occupying RAM

since BSS is considerably less than 1024 bytes, why does the second work, but the first doesn't? If it's DATA+BSS then both occupy more than 1024.

re-edit: I edited the question to include the code, but now I've removed it because it really had nothing to do with the problem (other than maybe poor coding practices, variable declarations and the like). You can review the code by looking back through the edits if you really want to see it. I wanted to get back to the question at hand, which was more based around: How to measure RAM usage.
12
  • I thought I would add, I have added various new sections of code over the last few weeks, then optomised it until it works, but now I have only added half a doz byte vars and I'm done... :(
    – Madivad
    Commented Mar 16, 2014 at 15:13
  • Do you use String type in your programs? This is known to perform frequent dynamic memory allocations and releases, which may fragment the heap to the point where you may no memroy left.
    – jfpoilpret
    Commented Mar 16, 2014 at 15:28
  • @jfpoilpret I stay away from Strings because of the overhead. I'm happy working with char arrays, that said, I almost always define all my char arrays with a fixed size (at the moment, I have ONE byte array that isn't purely because I change the content length for different recompiles.
    – Madivad
    Commented Mar 16, 2014 at 15:40
  • Posting your code here (or to pastebin if it's too big) may hekp find out what problems you encounter with memory.
    – jfpoilpret
    Commented Mar 16, 2014 at 17:21
  • @jfpoilpret I can't really post the code, it's huge and unfortunately very bloated, spread over 16 files. It was a project that I was allowing to grow well beyond what was required (it is several projects merged together). I'm starting now to break it apart which I'm sure will help to fix the problem. Although there are some parts of it I need people to look at (or guide me on), I'll post those later.
    – Madivad
    Commented Mar 17, 2014 at 4:35

5 Answers 5

15

You can use the functions provided AVRGCC: Monitoring Stack Usage

The function was intended to check the stack usage but what it reports is the actual RAM that has never been used (during execution). It does so by "painting" (filling) the RAM with a known value (0xC5), and then checking the RAM area counting how many bytes have still the same initial value.
The report will show the RAM that has not been used (minimum free RAM) and therefor you can calculate the max RAM that has been used (Total RAM - reported RAM).

There are two functions:

  • StackPaint is executed automatically during initialization and "paints" the RAM with the value 0xC5 (can be changed if needed).

  • StackCount can be called at any point to count the RAM that hasn't been used.

Here is an example of usage. Doesn't do much but is intended to show how to use the functions.

// -----------------------------------------------------------------------------
extern uint8_t _end;
extern uint8_t __stack;

void StackPaint(void) __attribute__ ((naked)) __attribute__ ((section (".init1")));

void StackPaint(void)
{
#if 0
    uint8_t *p = &_end;

    while(p <= &__stack)
    {
        *p = 0xc5;
        p++;
    }
#else
    __asm volatile ("    ldi r30,lo8(_end)\n"
                    "    ldi r31,hi8(_end)\n"
                    "    ldi r24,lo8(0xc5)\n" /* STACK_CANARY = 0xc5 */
                    "    ldi r25,hi8(__stack)\n"
                    "    rjmp .cmp\n"
                    ".loop:\n"
                    "    st Z+,r24\n"
                    ".cmp:\n"
                    "    cpi r30,lo8(__stack)\n"
                    "    cpc r31,r25\n"
                    "    brlo .loop\n"
                    "    breq .loop"::);
#endif
} 


uint16_t StackCount(void)
{
    const uint8_t *p = &_end;
    uint16_t       c = 0;

    while(*p == 0xc5 && p <= &__stack)
    {
        p++;
        c++;
    }

    return c;
} 

// -----------------------------------------------------------------------------

void setup() {

Serial.begin(9600);
}

void loop() {
  // put your main code here, to run repeatedly:
Serial.println(StackCount(), DEC);  // calls StackCount() to report the unused RAM
delay(1000);
}
5
  • interesting piece of code, thanks. I did use it, and it suggests there's 600+ bytes available, but when I bury that in the deeper subs it does reduce, but doesn't wipe out. So MAYBE my problem is elsewhere.
    – Madivad
    Commented Mar 17, 2014 at 4:36
  • @Madivad Note that this 600+ bytes represents the minimum available amount of RAM up to the point when you called the StackCount. It doesn't really make a difference how deep you place the call, if the majority of the code and nested calls have been executed before calling StackCount then the outcome will be correct. So for example you can leave your board working for a while (as long as it takes to get enough code coverage or ideally until you get the misbehavior you describe) and then push a button to get the reported RAM. If there is enough then it's not the cause of problem.
    – alexan_e
    Commented Mar 17, 2014 at 10:39
  • 1
    Thanks @alexan_e, I have created an area on my display that reports this now, so as I progress over the next few days I'll watch this number with interest, especially when it fails! Thanks again
    – Madivad
    Commented Mar 17, 2014 at 11:24
  • @Madivad Please note that the given function will not report correct results if malloc() is used in the code
    – alexan_e
    Commented Mar 20, 2014 at 7:42
  • thanks for that, I am aware, it has been mentioned. As far as I'm aware, I'm not using it (I know that there may be a library using it, I haven't checked fully yet).
    – Madivad
    Commented Mar 20, 2014 at 8:18
10

The main issues you can have with memory usage at runtime are:

  • no available memory in the heap for dynamic allocations (malloc or new)
  • no room left on the stack when calling a function

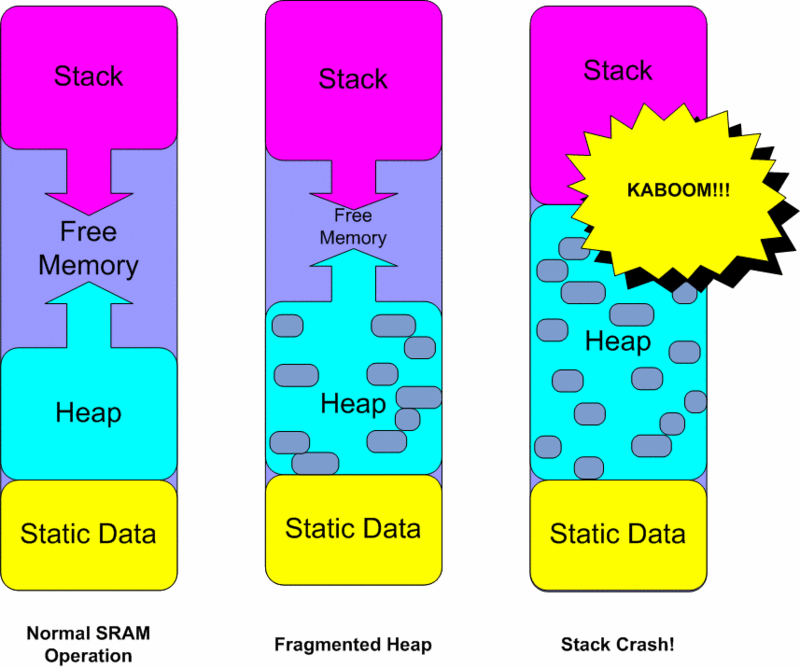
Both are actually the same as the AVR SRAM (2K on Arduino) is used for both (in addition to static data which size never changes during program execution).

Generally, dynamic memory allocation is seldom used on MCUs, only a few libraries typically use it (one of them is String class, which you mentioned you don't use, and that's a good point).

The stack and the heap can be seen in the picture below (courtesy of Adafruit): enter image description here

Hence, the most expected issue comes from stack overflow (i.e. when the stack grows towards the heap and overflows on it, and then -if the heap was not used at all- overflows on the static data zone of the SRAM. At that time, you have a high risk of either:

  • data corruption (i.e. the stack ovewrites heap or static data), giving you ununderstandable behavior
  • stack corruption (i.e. the heap or static data overwrites stack content), generally leading to a crash

In order to know the amount of memory that's left between the top of the heap and the top of the stack (actually, we might call it the bottom if we represent both the heap and the stack on the same image as depicted below), you can use the following function:

int freeRam () {
  extern int __heap_start, *__brkval; 
  int v; 
  return (int) &v - (__brkval == 0 ? (int) &__heap_start : (int) __brkval); 
}

In the code above, __brkval points to the top of the heap but is 0 when the heap has not been used, in which case we use &__heap_start which points to __heap_start, the first variable that marks the bottom of the heap; &v points of course to the top of the stack (this is the last variable pushed on the stack), hence the formula above returns the amount of memory available for the stack (or the heap if you use it) to grow.

You can use this function in various locations of your code to try and find out where this size is getting dramatically reduced.

Of course, if ever you see this function return a negative number then it is too late: you have already overflown the stack!

7
  • 1
    To moderators: sorry for putting this post to community wiki, I must have made somthing wrong while typing, in the middle of the post. Please put it back here as this action was unintentional. Thanks.
    – jfpoilpret
    Commented Mar 17, 2014 at 20:55
  • thanks for this answer, I literally only JUST found that piece of code barely an hour ago (at the bottom of playground.arduino.cc/Code/AvailableMemory#.UycOrueSxfg ). I haven't included it yet (but I will) since I have quite a large area for debugging on my display. I think I've been confused about dynamically assigning stuff. Is malloc and new the only way I can do that? If so, then I have nothing dynamic. Also, I've just learned the UNO has 2K of SRAM. I thought it was 1K. Taking these into consideration, I'm not running out of RAM! I need to look elsewhere.
    – Madivad
    Commented Mar 17, 2014 at 21:49
  • In addition, there is also calloc. But you may be using 3rd party libs that use dynamic allocation without you knowing (you'd have to check source code of all your dependencies to be sure about it)
    – jfpoilpret
    Commented Mar 17, 2014 at 21:57
  • 2
    Interesting. The only "problem" is that it reports the free RAM at the point where it's called, so unless it's placed in the right part you may not notice a stack overrun. The function I have provided seems to have an advantage in that area since it report the min free RAM up to that point, once a RAM address has been used, it's not reported free any longer (on the down side there may be some occupied RAM bytes that match the "paint" value and are reported as free). Apart from that maybe one way suits better than the other depending on what a user wants.
    – alexan_e
    Commented Mar 20, 2014 at 7:40
  • Good point! I had not noticed this specific point in your answer (and for me that looked like a bug in fact), now I see the point of "painting" the free zone upfront. Maybe you could make this point more explicit in your answer?
    – jfpoilpret
    Commented Mar 20, 2014 at 7:58
7

When you figure out how to locate the generated .elf file in your temporary directory, you can execute the command below to dump a SRAM usage, where project.elf is to be replaced with the generated .elf file. The advantage of this output is the ability to inspect how your SRAM is used. Do all the variables need to be global, are they really all required?

avr-objdump -S -j .bss project.elf

project.elf:     file format elf32-avr


Disassembly of section .bss:

00800060 <__bss_start>:
        ...

00800070 <measurementReady>:
        ...

00800071 <cycles>:
        ...

00800073 <measurement>:
  800073:       00 00 00 00                                         ....

00800077 <measurementStart>:
  800077:       00 00 00 00                                         ....

0080007b <timerOverflows>:
  80007b:       00 00 00 00

Notice that this doesn't show stack or dynamic memory use as Ignacio Vazquez-Abrams noted in the comments below.

Additionally a avr-objdump -S -j .data project.elf can be checked, but none of my programs output anything with that so I can't tell for sure if it is useful. It supposed to list 'initialized (non-zero) data'.

3
  • Or you could just use avr-size. But that won't show you dynamic allocations or stack usage. Commented Mar 16, 2014 at 20:37
  • @IgnacioVazquez-Abrams about the dynamics, same for my solution. Edited my answer.
    – jippie
    Commented Mar 16, 2014 at 20:40
  • Ok, this is the most interesting answer so far. I've experimented with avr-objdump and avr-size and I'll edit my post above shortly. Thanks for this.
    – Madivad
    Commented Mar 17, 2014 at 4:38
3

I suspected for a while that I was getting to the end of available RAM. I don't think I'm using too much stack (although it's possible), what is the best way to determine how much RAM I am actually using?

It would be best to use a combination of manual estimation and by using the sizeof operator. If all your declarations are static, then this should give you an accurate picture.

If you are using dynamic allocations, then you may run into a problem once you start deallocating the memory. This is due to memory fragmentation on the heap.

Going through and trying to work it out, I have problems when I get to enums and structs; how much memory do they cost?

An enum takes as much space as an int. So, if you have a set of 10 elements in a enum declaration, that would be 10*sizeof(int). Also, every variable that uses an enumeration is simply an int.

For structures, it would be easiest to use sizeof to find out. Structures occupy a (minimum) space equal to sum of its members. If the compiler does structure alignment, then it may be more, however this is unlikely in the case of avr-gcc.

5
  • I do statically assign everything as far as I can. I never thought of using sizeof for this purpose. At the moment, I have almost 400 bytes already accounted for (globally). Now I'll go through and calculate the enums (manually) and the structs (of which I have a few—and I'll use sizeof), and report back.
    – Madivad
    Commented Mar 16, 2014 at 15:49
  • Not sure you really need sizeof to know the size of your static data as this gets printed by avrdude IIRC.
    – jfpoilpret
    Commented Mar 16, 2014 at 16:15
  • @jfpoilpret That is version dependent, I think. Not all versions and platforms provide that. Mine (Linux, multiple versions) don't show memory use for one, while Mac versions do.
    – asheeshr
    Commented Mar 16, 2014 at 16:36
  • I have searched the verbose output, I thought it should be there, it isn't
    – Madivad
    Commented Mar 16, 2014 at 16:38
  • @AsheeshR I was not aware of that, mine works fine on Windows.
    – jfpoilpret
    Commented Mar 16, 2014 at 17:22
1

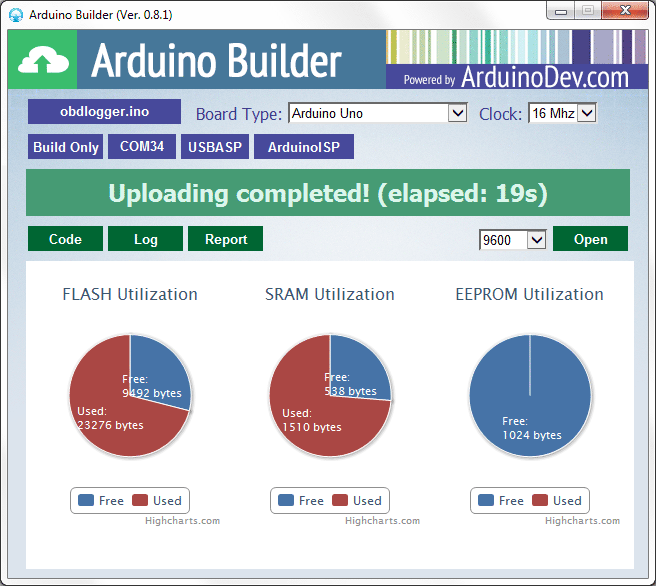
There is a program called Arduino Builder that provides a neat visualization of the amount of flash, SRAM and EEPROM your program is using.

Arduino Builder

The Arduino builder makes up part of the CodeBlocks Arduino IDE solution. It can be used as either a standalone program or through the CodeBlocks Arduino IDE.

Unfortunately Arduino Builder is a little old but it should work for most programs and most Arduinos, such as the Uno.

Your Answer

By clicking “Post Your Answer”, you agree to our terms of service and acknowledge you have read our privacy policy.

Not the answer you're looking for? Browse other questions tagged or ask your own question.